In many time series machine learning problems the with large number of features the raw data might contain
– abnormal / extreme points
– discontinuities
– stale data
To help with determining quickly abnormal or extreme points we can use z-transform of the time series.
To dtermine if time series contain discountinuities we can calculate how much removing one point changes sum of first difference of the time series.
and lastly to determine stale/predictable data we can use permutation-entropy implemented in python package pyentrp.
The code to run all the 3 tests at once is present below:
from scipy.stats import chi2
from pyentrp.entropy import permutation_entropy as pentropy

def smoothcoef(y):
    y=npa(y).flatten()
    ymax=max(np.abs(y).max(),0.0000001)
    tv=np.zeros(len(y))
    for i in range(len(y)-1):
        try:
            tv[i]=np.abs(np.diff(np.delete(y,i),1)).sum()
        except:
            ipdb.set_trace()
    tv=np.delete(tv,[0,len(tv)-1])
    tv=np.abs(np.diff(tv,1))
    return tv.max()/ymax

def abnormality(ts,thresh,retpoints=False,plot=False): #high values means abnormal
        avg=ts.mean()
        var=ts.var()
        nans=ts.isnull().sum()/len(ts)
        abnormal=(ts-avg)**2/var >chi2.interval(1-thresh, 1)[1]
        if plot:
            if (plot=='abnormal' and abnormal.any()) or plot=='all':
                plt.figure(figsize = (4, 4))
                plt.clf()
                plt.scatter(ts.index,ts.values,c=abnormal,cmap='bwr',marker='.')
                plt.show()
        res={}
        if retpoints:
            res['abnpoints']=ts[abnormal]
        return {**res,'abnormal':float(abnormal.any()),'nans':nans,'nunique':1-ts.nunique()/len(ts),'smooth':smoothcoef(ts.dropna()),'pentr':1-pentropy(ts.dropna(),normalize=True)}
Example usage is shown in the following code:
DF=pd.DataFrame
df=DF({'x':np.linspace(1,10,30)})
df['y']=np.sin(df['x'])
df
df['y'].iloc[4]=6
df[['y']].plot()
abnormality(df['y'],0.001,retpoints=False,plot='abnormal')
the result is show on the following figure:
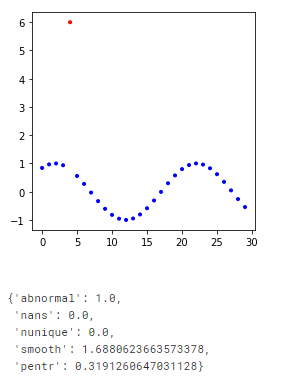
Interpretation of the results is the following:
Higher the number => more probability there is abnormality in the time series.
When plot parameter is specified graph will be shown with abnormal points in red.